Here's a summary of my product management work at Lucid from 2014 to 2019. I was most proud to have raised the product, BuildingOS.com, from initial venture capital rounds (Series A & B) through successful acquisition.
LEARN MORE
Lucid / BuildingOS.com7/1/2019 Nine months after the launch of BenchmarkMyBuilding.com, the U.S. Department of Energy published a second success story. Huge thanks to the author Drew Bittner, Editor for the Office of Energy Efficiency and Renewable Energy (EERE). I'm reposting here as an archive. Lucid and LBNL Partnership Produces Free Tool to Save EnergyA free tool to benchmark a building’s energy use…and save money? Well, that’s exactly the result of a partnership between Lucid Design Group of Oakland, CA, and the Lawrence Berkeley National Laboratory (LBNL). The two were brought together by EERE’s Small Business Voucher (SBV) program.
The SBV program, administered by EERE’s Technology-to-Market team, gives small businesses access to technical assistance from national labs. This helps companies overcome critical technology and commercialization challenges to bring the next generation of clean energy technologies to market. One of the first round recipients was Lucid through EERE’s Building Technologies Office. Working in the area of enhanced energy data management, their team aimed to improve energy data benchmarking of buildings by developing a tool to help justify and jumpstart building efficiency initiatives. While an increasing number of data sources are available to help identify energy and cost savings opportunities from smart technologies and sensor data, turning this data into energy efficiency projects presents a major challenge to building owners and operators. Through the SBV award, Lucid partnered with LBNL to bring simplified data analysis to a wider audience. LBNL helped Lucid integrate the Building Performance Database (BPD) and OpenStudio into Lucid’s BuildingOS, a service that automates collection, organization, and analysis of building energy data. According to Josh Wentz, who leads the BuildingOS product/engineering teams for Lucid, the BenchmarkMyBuilding.com tool the team created was an outgrowth of their SBV proposal. Although access to LBNL’s resources made BenchmarkMyBuilding.com feasible, it also changed what Lucid saw as the possibilities inherent in the partnership. For example, Lucid already provided enhanced energy data services with their existing platform, BuildingOS. This is subscription-based and serves customers already familiar with what those tools can do. Lucid found, in working with LBNL, that what would make the greatest impact would be a free, public tool. The outcome was BenchmarkMyBuilding.com, which Wentz says would not have existed without SBV. This allows Lucid to do more than offer energy management resources to their existing client base; it gives them the chance to bring technical energy savings data to a much wider audience. “There’s a huge benefit to creating this free tool,” Wentz says. “Lots of people who could save energy don’t know where to start, or even why they should. This provides clear data to help get them past the step of ‘why should I care’.” How does BenchmarkMyBuilding.com work? There are three inputs: building type, size and location. Building owners and operators expect that buildings with certain characteristics spend “X” dollars per year on energy—but they don’t always know how efficient they are, or how they compares to other buildings. BenchmarkMyBuilding.com leverages several government datasets—including EnergyStar’s TargetFinder and the Energy Information Agency’s CBECS data—to identify similar buildings. Getting a benchmarked annual energy cost is as simple and fast as entering a location into a mapping interface. But the team won’t stop here. According to Wentz, the next step is to build a deeper insight and analysis through modeling of individual building systems and assets to make the tool more versatile. And, he says, they couldn’t have done it without DOE. “Our work with LBNL is ongoing, even past this initiative, and we’ve learned from each other. DOE opened the door for us to do that.” After eight years of navigating funding proposals, Wentz says that the SBV program benefits the government and public, the private sector, and the national laboratories all at the same time. By partnering with LBNL through SBV, Lucid has provided the public with a free tool—that will save building owners money while promoting the value of data services. by DREW BITTNER Drew Bittner is a writer/editor for the Office of Energy Efficiency and Renewable Energy (EERE) within the U.S. Department of Energy. He is a former Presidential Management Intern and a former web project manager for EERE.
Quoted by the U.S. Department of Energy in a success story about BenchmarkMyBuilding.com.
“BenchmarkMyBuilding will allow us to expand the audience of building owners interested in saving energy and costs,” says Lucid’s Josh Wentz, the architect of BenchmarkMyBuilding, “we believe it will have great impact and we are thrilled.”
“None of this would have been possible without the DOE’s Small Business Voucher program, which brought together Lucid’s focus on design and business with LBNL’s expertise in modeling and building data analysis,” Wentz adds. “It was a great collaboration.”
Summary presentation in collaboration with Lawrence Berkeley National Laboratory
to the U.S. Department of Energy in Washington D.C. BenchmarkMyBuilding took twelve months to conceive, design, & build. Fifteen days after its launch, the U.S. Department of Energy posted a success story article. Huge thanks to the author Amir Roth, Technology Manager for BTO’s Building Energy Modeling (BEM) Program. I'm reposting here as an archive. Lucid Leverages DOE Tools and Small Business Program to Deliver Enhanced Energy Data ServicesCommercial buildings hold significant opportunities for both short-term and long-term energy and cost savings and corresponding opportunities for investment. An increasing number of data sources are available to help identify these opportunities—smart meter, smart thermostat, building automation system (BAS), and sensor data streams provide detailed information about the building while disclosure ordinances provide coarse-grain information about populations of similar buildings. However, turning this data into energy-efficiency projects still presents a challenge for building owners and operators.
One of the companies working to change that is Lucid, an Oakland, California, software startup whose BuildingOS service automates collection, organization, and analysis of building energy data. Started in 2004, Lucid works with more than 700 clients to track energy data in over 11,000 buildings representing more than a billion square feet. These clients use BuildingOS to aggregate and organize their various building energy data streams and to engage their occupants in improving building operations. Looking to expand its offering to benchmarking and deeper ECM analysis, Lucid turned to DOE’s innovative Small Business Voucher (SBV) program. Rather than competitively awarding money to small businesses, SBV awards the time, effort, and expertise of national lab scientists and engineers. The small business gains access to expertise—and sometimes to specialized lab facilities—it would not be able to afford on a full-time or contract basis. The lab and its scientists get the real-time real-world feedback that comes from commercial deployments. Lucid was paired with Lawrence Berkeley National Lab (LBNL) to help integrate Building Performance Database (BPD) and OpenStudio into BuildingOS. Along with the Environmental Protection Agency’s (EPA) ENERGY STAR TargetFinder, BPD was integrated into a new free benchmarking service, BenchmarkMyBuilding. LBNL helped Lucid leverage the more than 200,000 anonymized commercial building records within BPD—including records corresponding to the most recent Commercial Building Energy Consumption Survey (CBECS)—to create a consistent and statistically meaningful benchmark dataset. Lucid launched BenchmarkMyBuilding on March 15, 2017 as a gateway that allows building owners and property managers to engage with energy data using three simple, easy-to-acquire inputs—building location, building type (office, retail), and building square footage. These three inputs produce a performance distribution from similar buildings, hopefully leading owners of poorly performing buildings—really, owners of all buildings—to BuildingOS for more detailed and more actionable energy use tracking. “BenchmarkMyBuilding paves the way to integrate operational efficiency with retrofit analyses on a broad scale. By offering the DOE and EPA tools in an approachable user-friendly format, this application has the potential to make a tremendous impact on both business costs and the environment”, says Tianzhen Hong, an LBNL scientist who worked with Lucid on the project. “BenchmarkMyBuilding will allow us to expand the audience of building owners interested in saving energy and costs,” says Lucid’s Josh Wentz, the architect of BenchmarkMyBuilding, “we believe it will have great impact and we are thrilled.” LBNL also helped Lucid integrate OpenStudio into its BuildingOS premium service. Specifically, LBNL used OpenStudio to extend its Commercial Building Energy Saver (CBES) database of Energy Conservation Measure (ECM) savings estimates. LBNL extended CBES from 16 climate zones to 861 individual climate locations, added models for large office buildings, and evaluated six additional ECMs, including air-side economizers, high-performance chillers, and variable speed fans in air-handling units. These additions will allow BuildingOS users to investigate capital improvements in addition to operational ones. “None of this would have been possible without the DOE’s Small Business Voucher program, which brought together Lucid’s focus on design and business with LBNL’s expertise in modeling and building data analysis,” Wentz adds. “It was a great collaboration.” by DR. AMIR ROTH Amir Roth is the Technology Manager for BTO’s Building Energy Modeling (BEM) sub-program and has served in that role since 2010. BenchmarkMyBuilding.com - FAQ3/16/2017 This project was one of the greatest joys of my career. After launch of BenchmarkMyBuilding.com, there were a lot of questions, so we created a "Frequently Asked Questions" page on the Lucid / BuildingOS site. I'm reposting the source post here as an archive. Benchmark My Building FAQBenchmark My Building FAQFind answers to the most common questions we've received below. Don't see your question? Reach out to info@lucidconnects.com.
What is Benchmark My Building? The industry’s first free, self-service tool for benchmarking real-time building energy costs against similar buildings using the vast U.S. Department of Energy (DOE) and EnergyStar™ data set. Benchmark My Building generates an energy cost and consumption ranking for any building that compares it to the performance of similar buildings in similar climates. With this score energy managers can establish a baseline for conservation and cost reduction, and track improvements over time. Benchmark My Building was created in partnership between Lucid and the DOE, and is a free online tool that gives facilities managers the ability to quickly and accurately understand how their building is performing against similar buildings. Learn more about the launch & collaboration. What are the building databases / data sources used to generate the results? BenchmarkMyBuilding leverages both ENERGY STAR and DOE databases to quickly benchmark your annual energy cost and consumption against a dataset representative of 4.8 million buildings comprising 68 billion square feet. Specific datasets and APIs include:
How many buildings are represented in the benchmarking results? 1. ENERGY STAR Target Finder
2. DOE Building Performance Database (BPD)
What do I need to enter? There is a basic and advanced series of 3 and 2 entry fields, respectively. Basic - 3 simple inputs: building address, building type, and building size.The basic entries match your building to a profile type in the database so we can compare it to similar buildings. Median and comparison annual energy cost and consumption is graphed for easy comparison. Advanced - 2 additional inputs: annual building energy cost and consumption.The advanced entries personalize your report so that you can directly compare your building's costs and consumption with its peers at the median (national average), 75th, and 90th percentiles. What is a good result for my building?
What can I do with these results?
Why isn't my building/property type listed as an option? We can only support the same 21 (of 80) property types that Energy Star supports, so the types available are contingent on those eligible to receive an ENERGY STAR score. BenchmarkMyBuilding requires property types which are eligible to receive a score because we reverse engineer that score, so we can reveal the underlying median/75th/90th percentile annual energy cost. View a summary of eligible building types on the U.S. Environmental Protection Agency's ENERGY STAR website, and read more about the other eligibility criteria for ENERGY STAR scores. I am curious about the differences between BenchmarkMyBuilding and Energy Star Portfolio Manager. BenchmarkMyBuilding uses both EnergyStar and the DOE Building Performance Database. Think of it as a lower barrier to entry and more visual way to understand where your building stands. Is the report showing Site EUI or Source EUI?Site EUI is referenced in BenchmarkMyBuilding's output. This is noted on the X-axis of the histogram card. Does BenchmarkMyBuilding calculate EUI using the same data as Portfolio Manager? Or putting it another way, would I get the same result if I put a building into BMB as calculating EUI with Portfolio Manager on the same day? For EUI benchmarks - yes - BenchmarkMyBuildig accesses the same underlying dataset of ENERGY STAR Portfolio Manager, which is the Commercial Buildings Energy Consumption Survey (CBECS), via ENERGY STAR Target Finder. For clarity, the personalized EUI of your building in Portfolio Manager does not change daily but rather monthly, based on your building's latest 12 months of data. For personalized EUI of your building, as long as the 12 months summed and entered into BenchmarkMyBuilding represent the same most recent 12 months Portfolio Manager uses to calculate your EUI, then yes, the EUIs will be the same. Are there slides which describe BenchmarkMyBuilding? Check out the launch webinar video and presentation, here. Source: https://lucidconnects.com/library/blog/benchmark-my-building-faq BenchmarkMyBuilding.com - Public Launch3/15/2017 We had an incredible team working behind the scenes to craft the beautifully designed and creatively engineered BenchmarkMyBuilding.com. This tool ultimately benefited us all: the public (since it's freely available to anyone), the government / public sector (since it commercializes national lab technology), the private sector (since Lucid and other companies were able to use this as a sales tool), and the planet (because it teaches & encourages building owners to save energy). Leading this project was one of the greatest joys of my career. I'm reposting the source launch post here as an archive. BenchmarkMyBuilding.com – See how your energy cost and use stacks up against peersToday we announced that Lucid and the Department of Energy (DOE) national lab have teamed up to provide a free energy benchmarking tool for energy managers, building operators and sustainability managers. Using the tool, called Benchmark My Building, users can benchmark not only their energy use, but also their costs, against similar buildings in similar climates.
Benchmarking building energy costs against the extensive datasets of Energy Star and the DOE has been arduous in the past. It is now easier than ever to see how buildings compare against peers in terms of dollars, and to make the business case for performance improvement projects. To get started, users simply enter three inputs (building type, building size, and building location) to benchmark their buildings against Energy Star and DOE datasets representative of 68 billion square feet of commercial building space in seconds. This broad understanding of energy performance begins to reveal how organizations can think about energy and improve their overall performance. The real magic happens when a user adds two more inputs (annual energy cost and annual kBTU usage) to gain access to a customized energy cost and consumption report that compares specific buildings with peer buildings that are performing at the median, 75th, and 90th percentiles. With this information, a building operator, facilities manager or sustainability professional can truly start to dig in to strategies that achieve greater savings and maximum conservation. Using BenchmarkMyBuilding.com to regularly check a building’s performance provides a measurable benchmark of progress. BenchmarkMyBuilding converts scores to the metric that everyone cares about most: Cost. BenchmarkMyBuilding reveals the annual building energy cost at the top of every report. This dollar amount represents the median annual energy cost for buildings of the same exact type, size, and location. Performance will fall into one of the following categories:
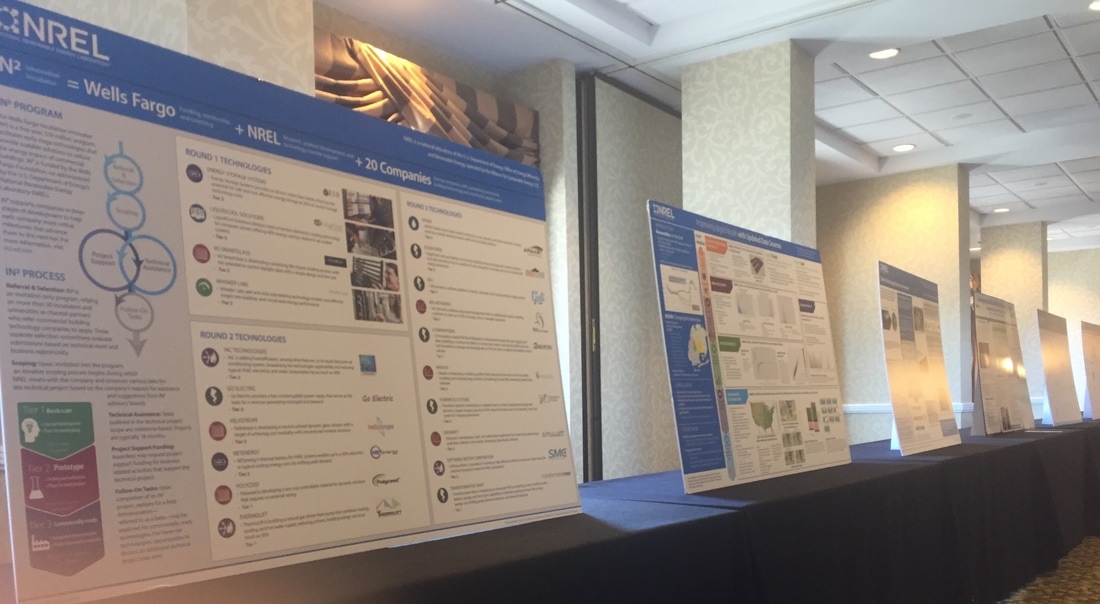
So, why do you care? Because the first step to savings and conservation is understanding what is possible. With this important energy benchmark, building managers finally have a standard scale to be used for calculating the potential value of improved performance and measuring progress. And, working with Lucid, we can dive deep into energy use and waste, and ensure that building scores continue to improve. I’d encourage all building owners to use the free offering, and then to bring your score to Lucid. We’ll show you how to use real-time data to minimize waste and maximize savings. Credits. This project was made possible by the U.S. Department of Energy (DOE) Small Business Voucher program, which pairs U.S. Department of Energy National Labs with small businesses. Starting in March 2016, Lawrence Berkeley National Laboratory (LBNL) and Lucid began collaboration in Oakland, CA. Twelve months later, on March 15, 2017 presented in Washington D.C., BenchmarkMyBuilding.com was born. Collaborators from LBNL include Tianzhen Hong (Lead Research Scientist), Yixing Chen (Associate Engineering Developer), Jessica Granderson (Deputy of Research), Paul Mathew (Principal Investigator of DOE Buildings Performance Database). Collaborators from Lucid include Josh Wentz (Product Architect), Nathan Gould (Data Scientist), Gavin Platt (Product Designer), Ralf VonSosen (Marketing Launch), Rob Skidmore (Web Software Engineer), Irwin Simpleo (Product Designer), Paul McNett (API Software Engineer). Learn more with BenchmarkMyBuilding's Frequently Asked Questions (FAQ) and the Launch Webinar Video & Slides. Check out the tool at BenchmarkMyBuilding.com! -by (me) Josh Wentz, Director of Product & Engineering, BuildingOS.com Source: https://lucidconnects.com/library/blog/benchmarkmybuilding GE Energy Leadership Program8/12/2011
|